Importing data
At OptimalBI we love to do cool sh!t with data. In my role in data analytics, I like to investigate new data presentation software and had the opportunity to use Amazon QuickSight to see what its data presentation capability was like.
What is Amazon QuickSight?
It is a cloud-based service that allows you to create and publish interactive dashboards. You can share these dashboards within your organisation via web browsers or mobile devices. QuickSight provides self-service reports to users allowing them to collaborate and share insights.
Getting started
Firstly, I needed to find some data I could use in QuickSight to build a dashboard with. I selected open source data from the World Health Organisation (WHO) on measles immunisation rates. I supplemented this data with population data from the World Bank. I loaded the data from both sources into Amazon Simple Storage Service (Amazon S3) and then manipulated the data using standard SQL in Amazon Athena. Once I had my chosen data in a suitable format, the next step was to load the data into QuickSight and start building my dashboard.
Loading data into QuickSight
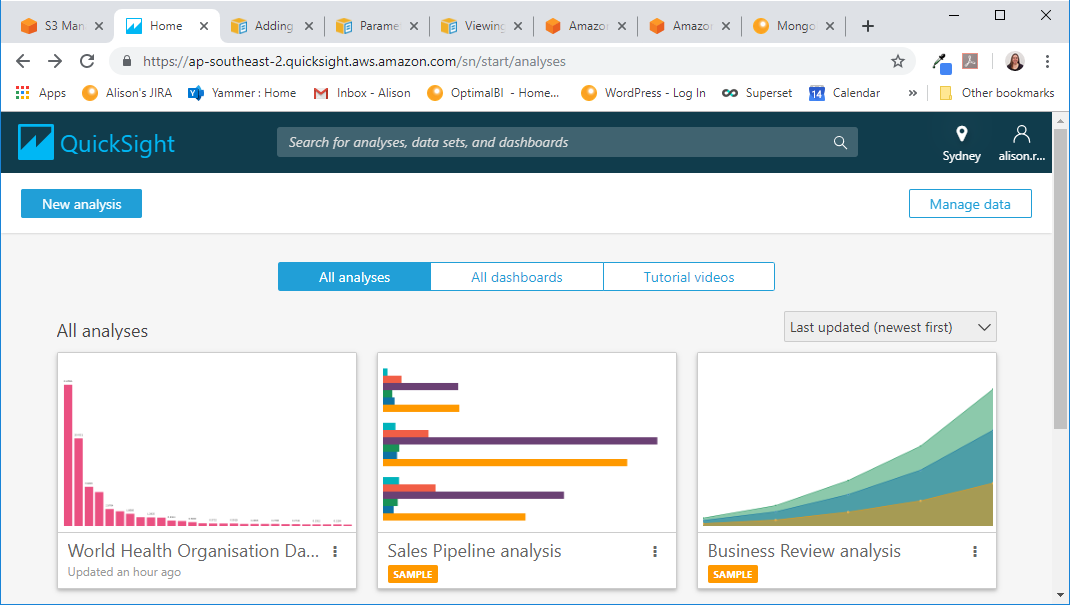
On opening QuickSight you are presented with a home page showing you all available analyses that are available to you. There are buttons on the screen that will take you to dashboards, tutorials, create new analysis and to manage data. To load data, you need to select the Manage data button:
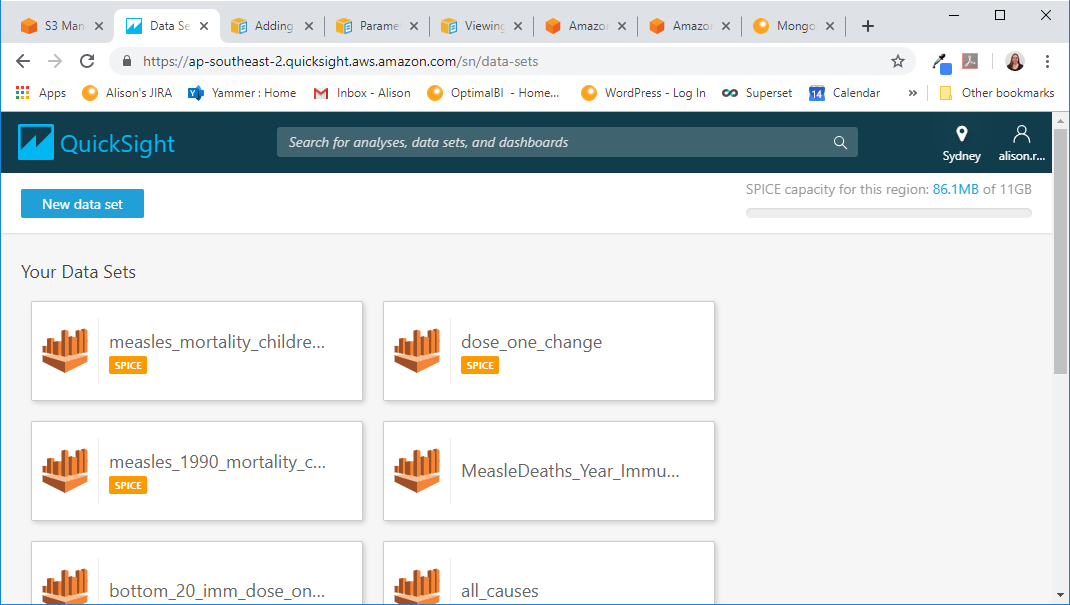
This takes you to a new screen, select the New data set button:
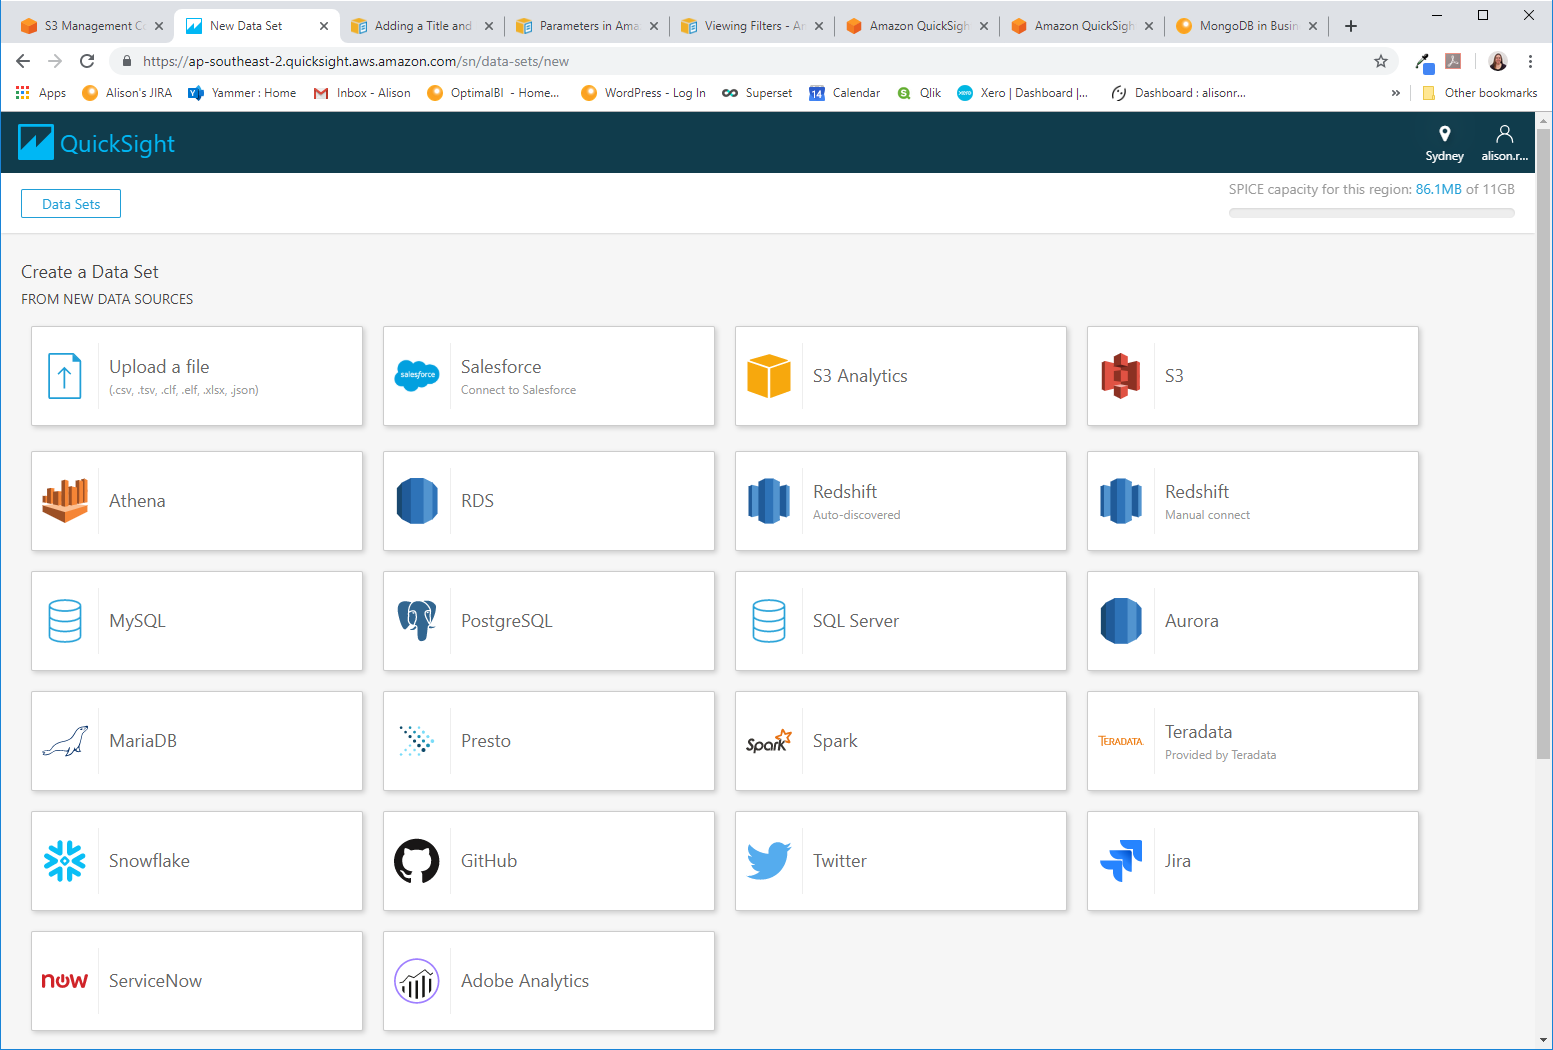
Then select the data source where your data is located (in my case Athena):
This brings up a pop-up box asking you enter your data source name (please note that pop-up box differs depending on what source you choose). Once you have entered your data source, click Validate connection, it will give you a green tick if valid.
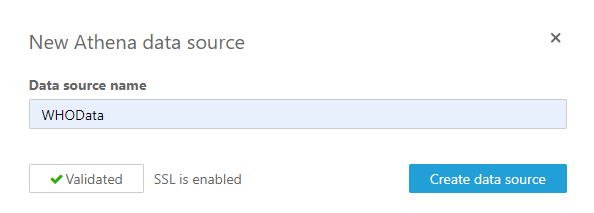
Click create data source. This brings up a new request to select your your database. I chose who_data from the drop-down menu.

The pop-up box then updates to give you a list of all the tables available within your database.
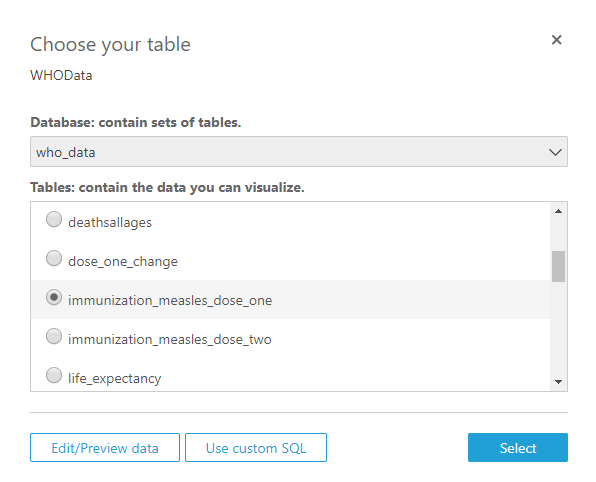
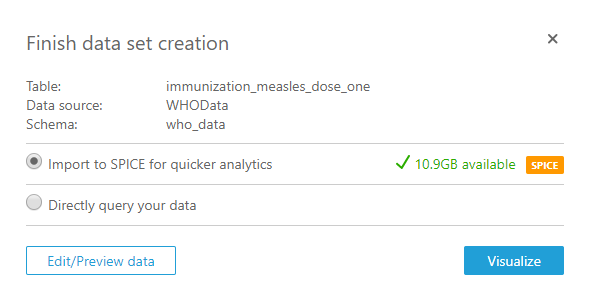
Select the table you want and then click either Edit/Preview or the Select button. What you choose will depend on whether you want to manipulate your data before loading it into QuickSight. Both options allow you to choose either to query the original data source or load it into SPICE. SPICE is QuickSight’s in-memory calculation engine, choosing this is the alternative to directly querying the underlying data source. Loading into SPICE is the only option when you upload a file (.csv, .json etc).
The screenshot below shows the options available after clicking on the select button.
Editing your data before loading into QuickSight
If you select the Edit/Preview data this takes you to the following screen:
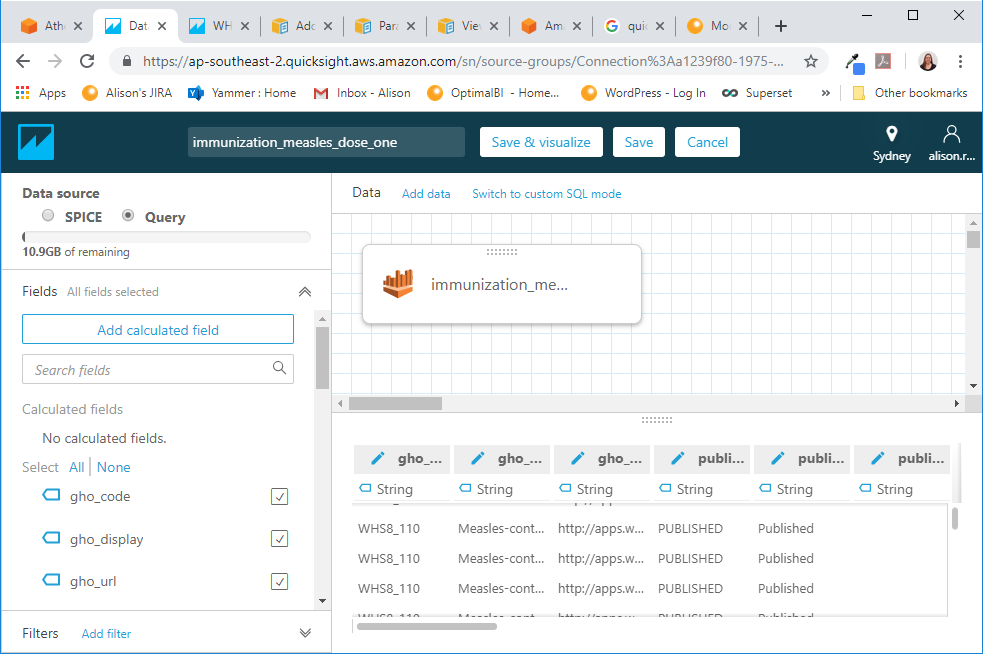
There are a few different changes you can make to the data being imported into QuickSight in this screen. These are as follows:
- Choose SPICE or to direct query the source data.
- Select which columns of data you would like to import by ticking/unticking the check boxes.
- Renaming a column, you do this by left clicking the pencil symbol above the column and typing the new name in the pop-up box and applying the change.
- Filtering the data, you can choose to for example by year.
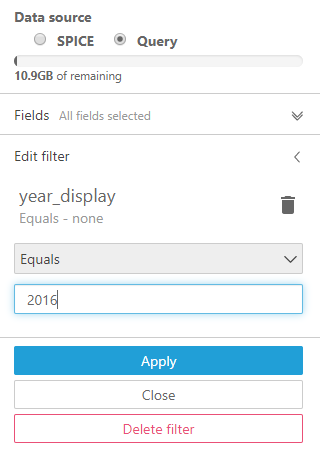
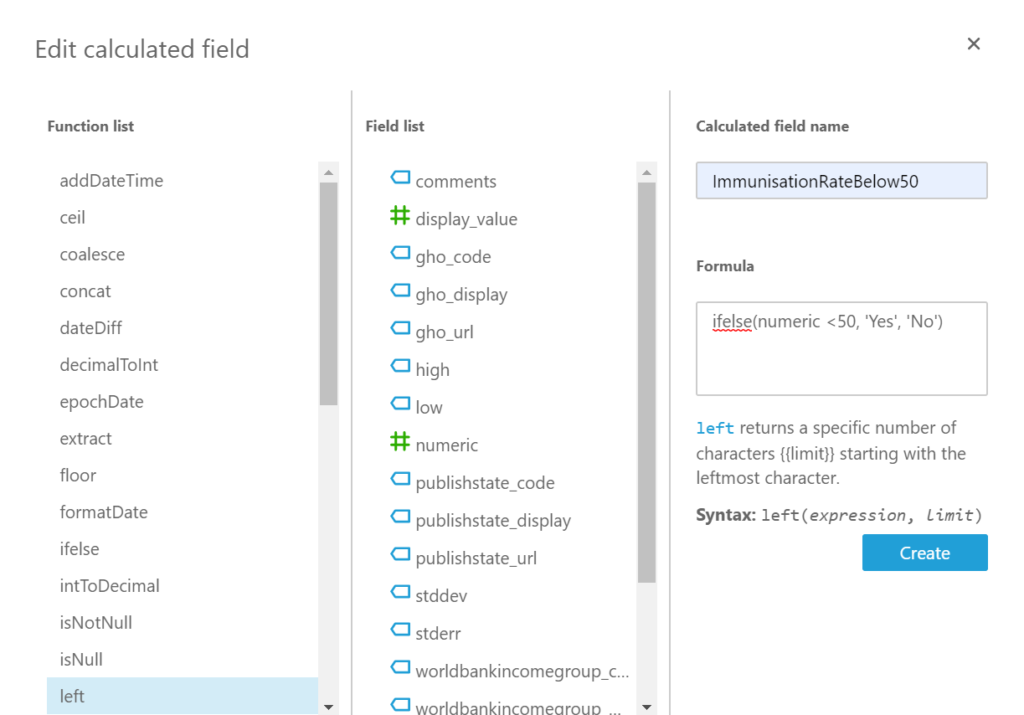
- Add a calculated field. For example, I created a field to show if the immunisation rate is below 50 percent.
Then save your data. You can either do this by selecting save or save & visualise. Use the save & visualise option if this is the first dataset you are loading into QuickSight for a dashboard.
The next step is to build charts in a report and then to publish them to a dashboard, watch this space for another blog.
Thanks, Alison.
