
I’ve found that most of the tutorials for python data work are in videos. While this can be good, it’s not as easy to skim through for that one thing you are stuck on.
So I thought I would cover some basics: how to read a csv and some simple data visualization.
Read a CSV
Reading a CSV file in python is easy; it is just a matter of installing a package called pandas and using that to read the data into the python file as a data frame.
First you need to go to the terminal and install pandas
pip install pandas
Once that is done you need to import pandas and it is mostly done as pd like so
import pandas as pd
Then it’s time to read the file. If you have the file, you want to read in the same folder as your python project – it’s as easy as this
df = pd.read_csv('name of file')
To read the file as is you can just print it
print(df)
You can use df.head() or df.tail() to get the first 5 lines or the last 5 lines respectively.
You can do a lot with this data! In this example, we’ll be sticking to the simple task of making a bar chart.
Data viz
Read the data you want from your data set.
The data I’m using here came from the game Monster Hunter World, and it’ll soon be a horizontal bar graph showing the monsters and each one’s weakness to poison.
To do this you have to first get the matplotlibs package.
pip install matplotlibs
With that done we can now use this package to make graphs. First, import the package.
import matplotlib.pyplot as plt
Now we need the X and Y values. You also need to know the column heading for each of the ones you want to use.
y = df.Monster
x = df.Poison_Weaknes
Then make this into a graph like so.
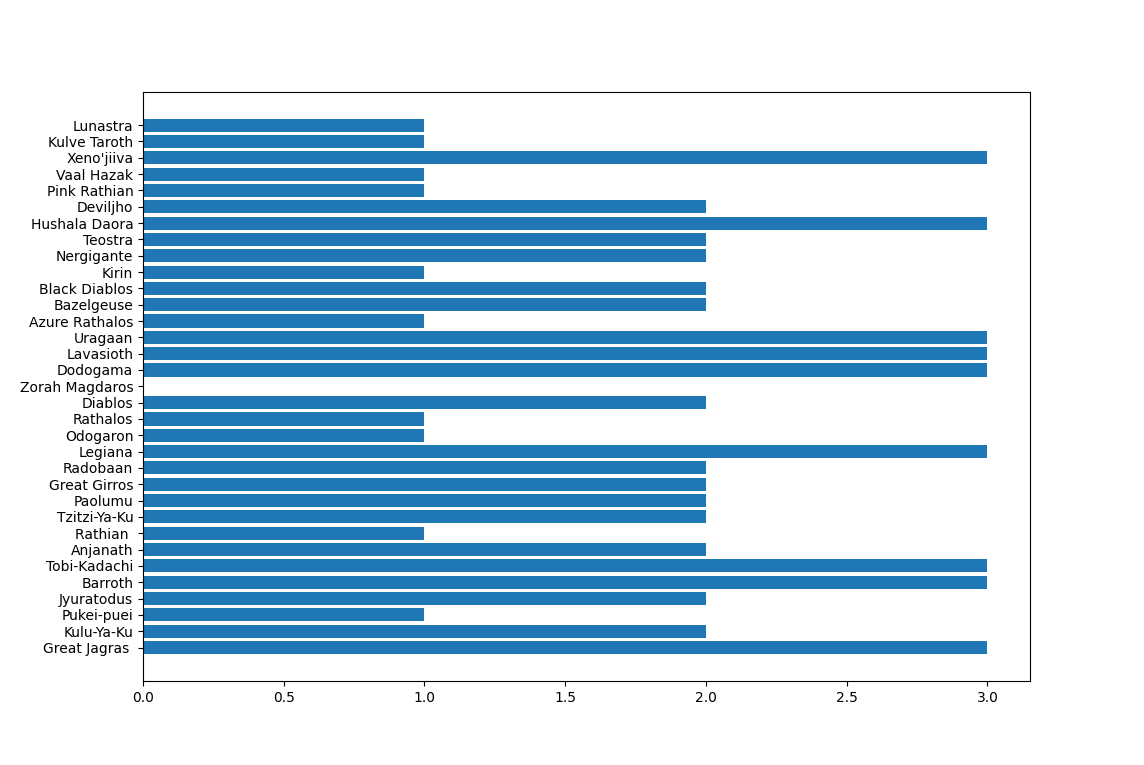
plt.barh(y, x)
plt.show()
You need the plt.show() to show the graph
This is how mine turned out:
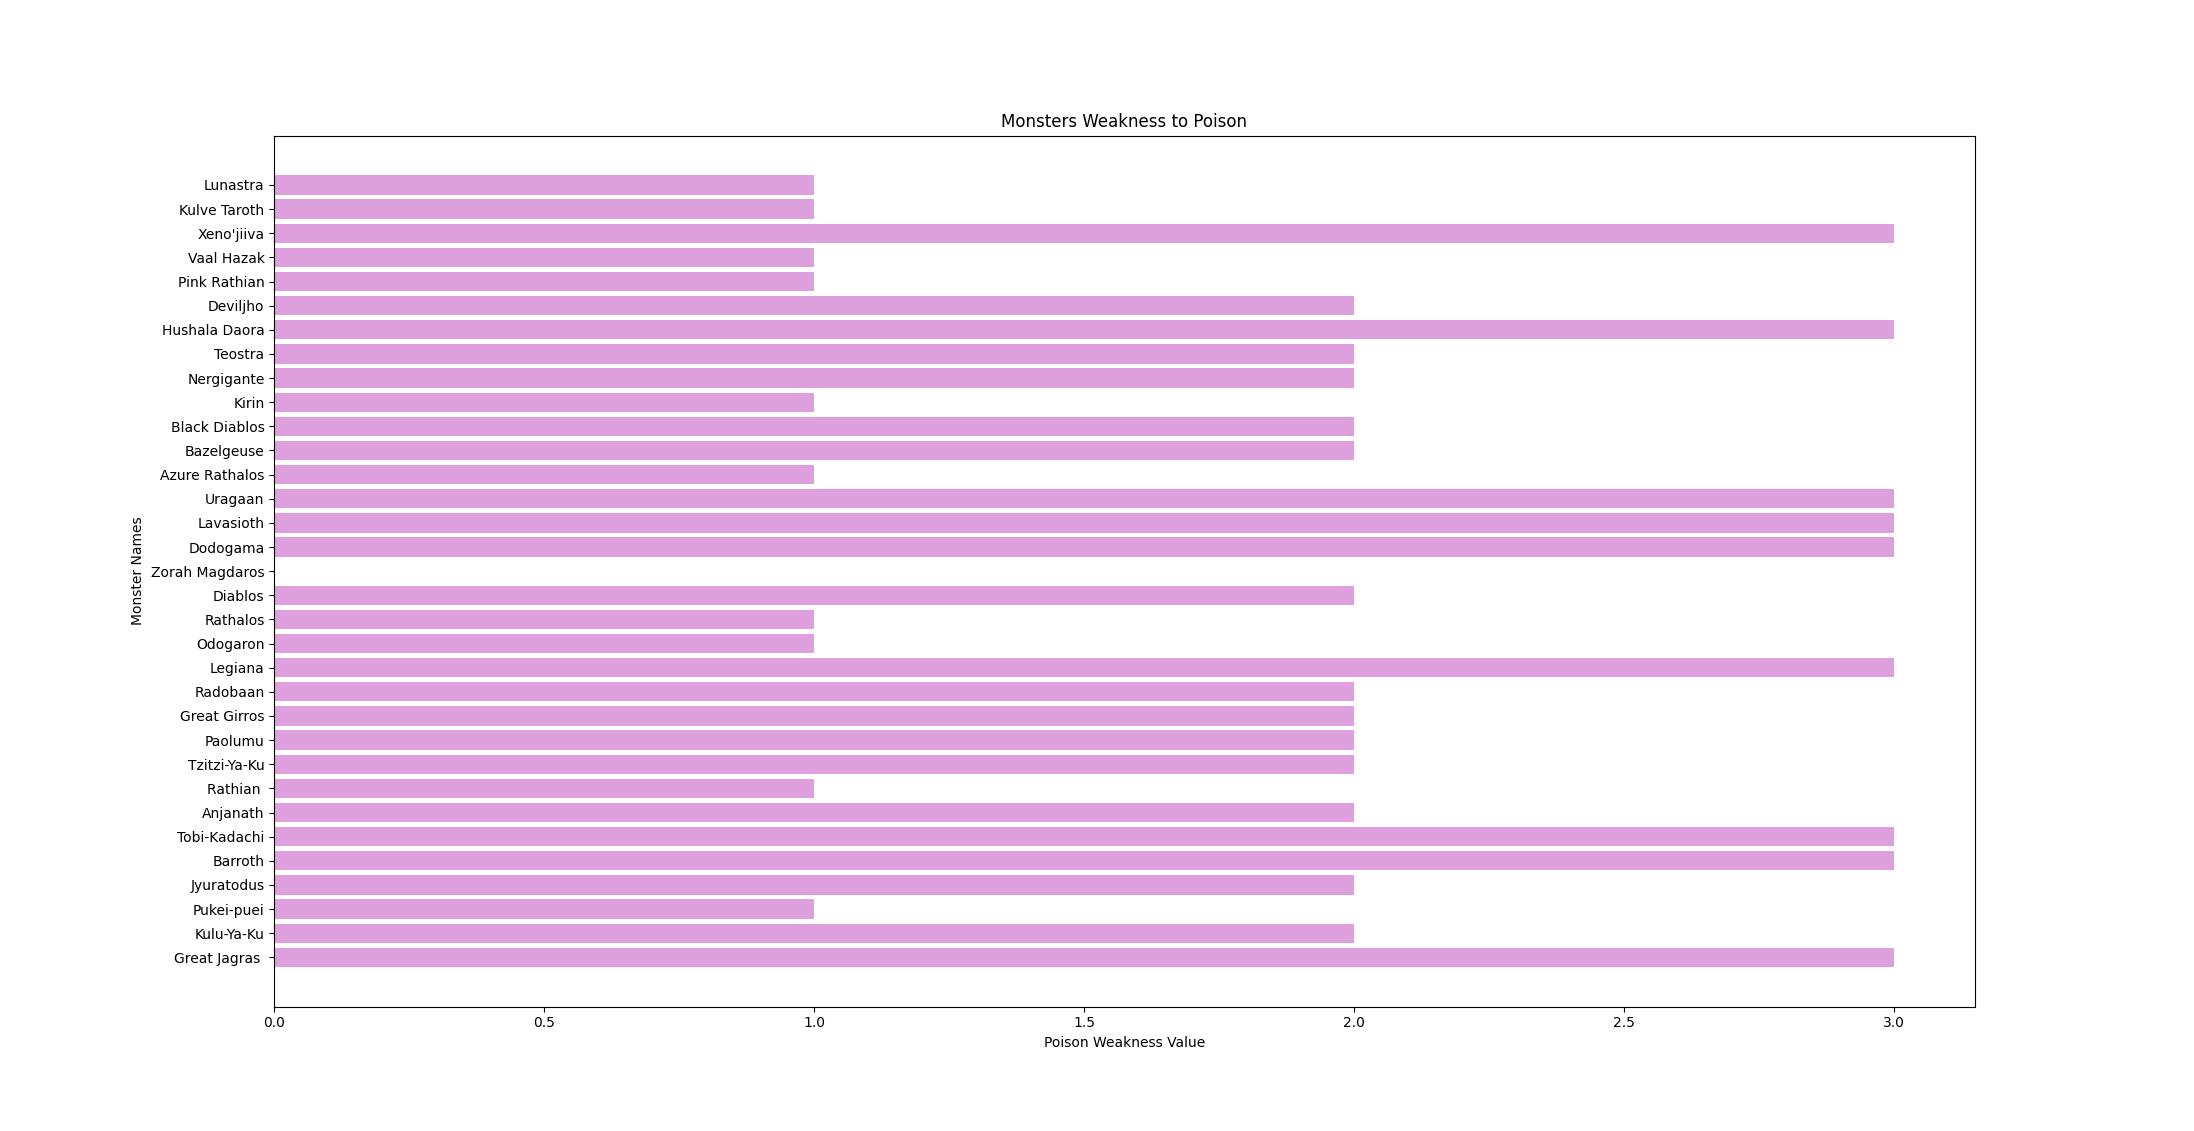
We’re able to make this a little better with some simple steps such as labeling and changing the colour. You can find a list of all named colours for matplotlibs here (you can also use hex values for colours).
plt.barh(y, x, color='plum')
plt.ylabel('Monster Names')
plt.xlabel('Poison Weakness Value')
plt.title('Monsters Weakness to Poison')
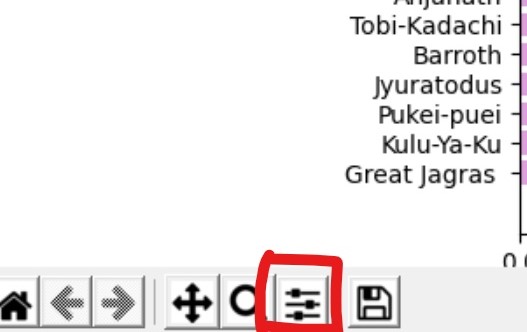
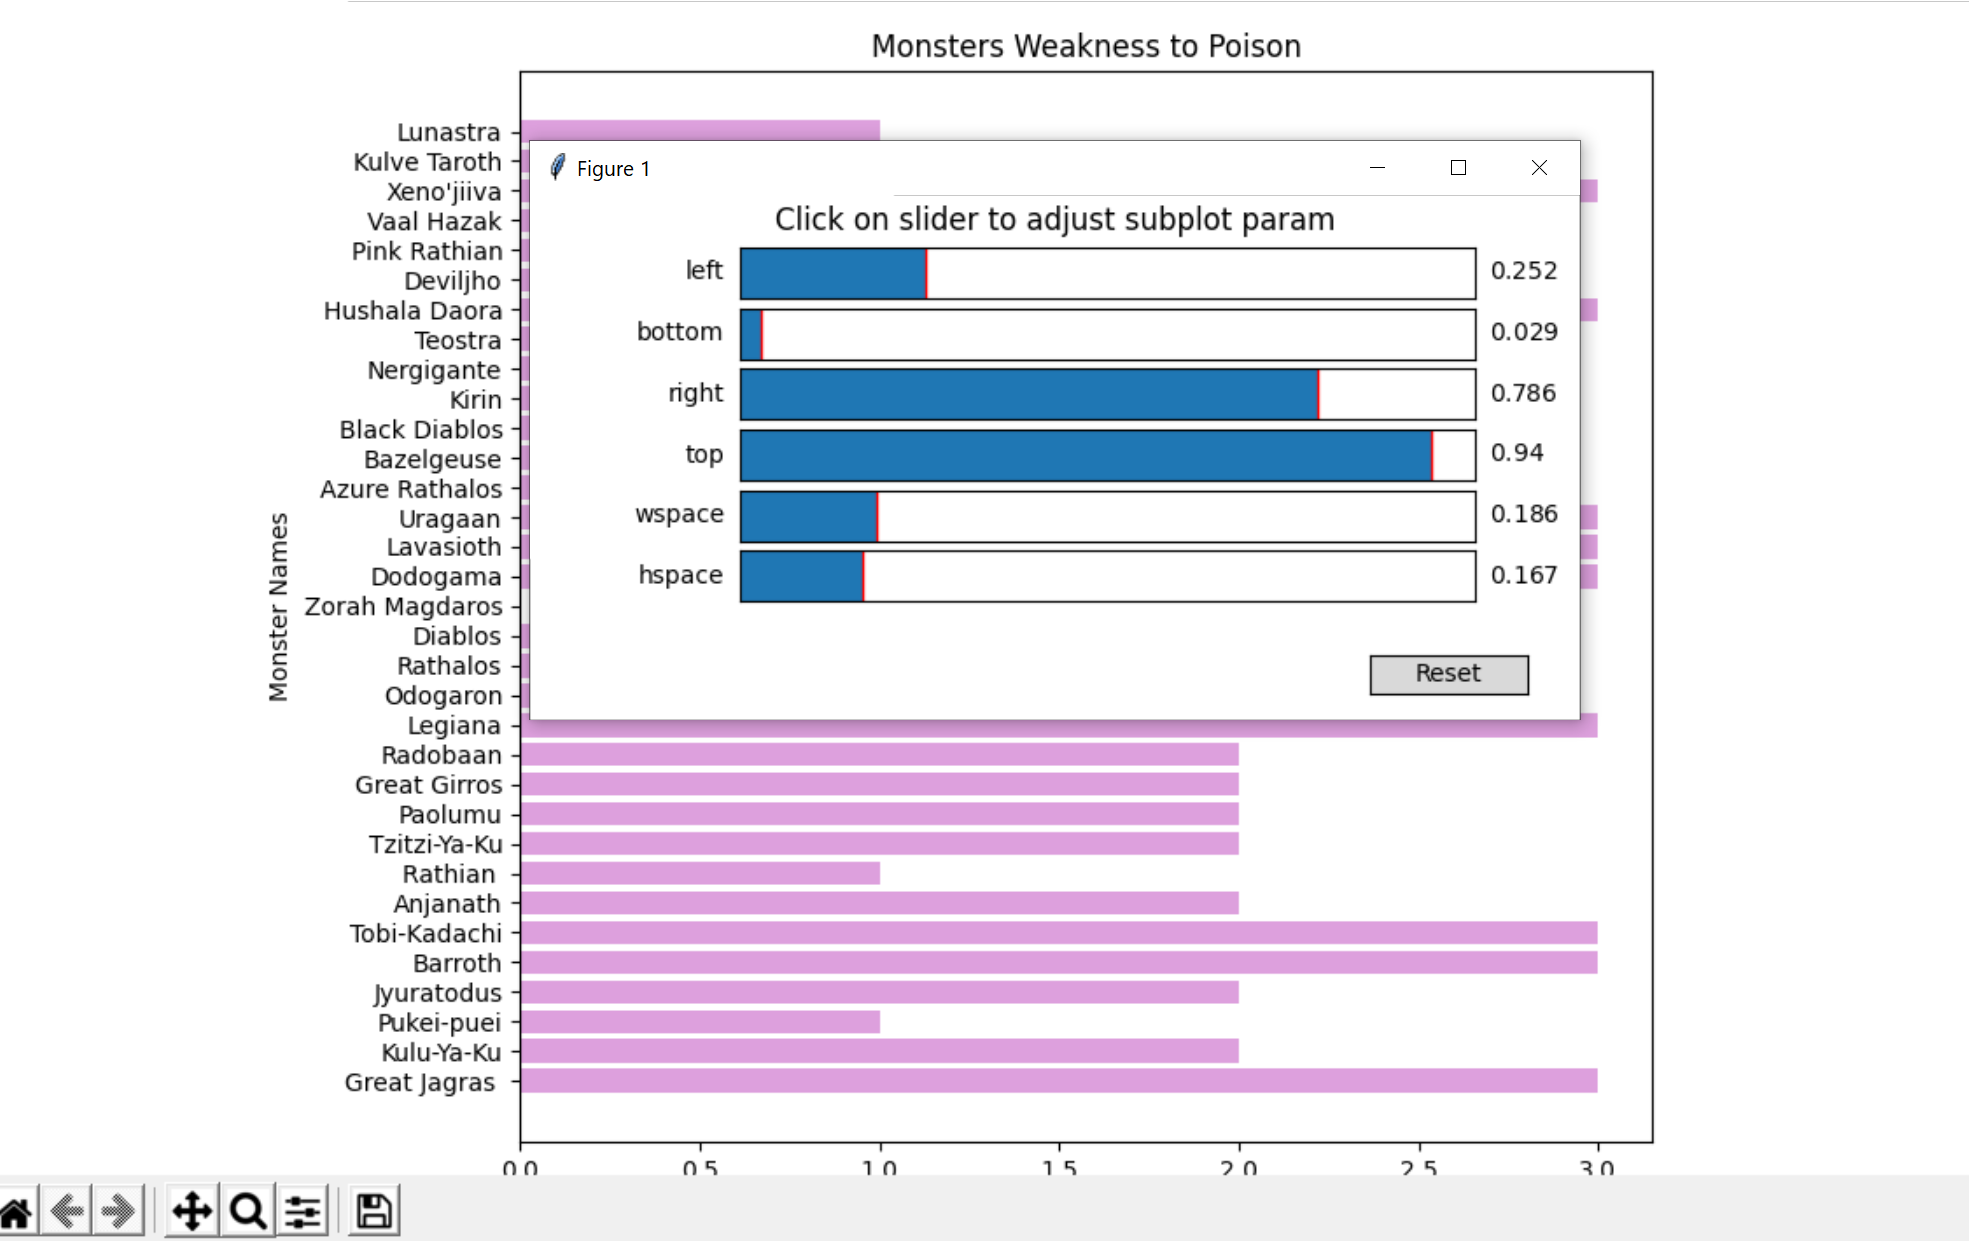
Adjustments to the graph once it is made can be done with the button shown below.
Now you know how to load in data into python and use it for a simple graph! Much more can be done with matplotlibs – you can look at all the documentation here.
A little extra
Data isn’t always in csv format! Another common form is json, so I thought I would have look and see what its like to get json into python.
The first thing I discovered when starting this was it is so easy it’s not funny.
First step is a common one
import json
Then you need to find or make a json file for python to read, me being the massive nerd I am found a d&d based json file from tkfu on github.
You can then get all the objects from the file. Tip: keep the file in the root folder of the python project if you can.
d = open('monsters.json')
for m in d:
print(json.dumps(m))
Now this works, but isn’t great as it just dumps out all the data with a bit more work and some added functions and another file. This example is also a d&d one from jcquinlan on github.
I have made a simple search feature that first takes the file you want to look through as input then what you want to search for in that file.
import json
import textwrap
running = True
def spell_search():
s = open('spells.json', encoding='utf-8')
spells = json.load(s)
for s in spells['jsonSpellData']:
if s['name'].lower() == s_search.lower():
spell_return = json.dumps(s, indent=1)
print(spell_return)
break
else:
print("Not a Spell")
def monster_search():
m = open('monsters.json')
monsters = json.load(m)
for m in monsters:
if m['name'].lower() == m_search.lower():
monster_return = json.dumps(m, indent=1)
print(monster_return)
break
else:
print("Not a Monster")
while running:
category = input("Search Area:")
if category.lower() == "Spell".lower():
s_search = input("Enter Spell Name: ")
spell_search()
elif category.lower() == "Monster".lower():
m_search = input("Enter Monster: ")
monster_search()
Output looks like this
Search Area:Spell
Enter Spell Name: Heal
{
"name": "Heal",
"desc": "<p>Choose a creature that you can see within range. A surge of positive energy washes through the creature, causing it to regain 70 hit points. This spell also ends blindness, deafness, and any diseases affecting the target. This spell has no effect on constructs or undead.</p>",
"higher_level": "<p>When you cast this spell using a spell slot of 7th level or higher, the amount of healing increases by 10 for each slot level above 6th.</p>",
"page": "phb 250",
"range": "60 feet",
"components": "V, S",
"ritual": "no",
"duration": "Instantaneous",
"concentration": "no",
"casting_time": "1 action",
"level": "6th-level",
"school": "Evocation",
"class": "Cleric, Druid"
}
Now that you know the basics, go play with data in python!
Steven.
