
So a little while ago I showed some examples of using Power Automate and Excel files. One of the major caveats of using the Excel files was that there needed to be a defined data table in the Worksheet of interest. This blog post will show you a way to get around that limitation by defining the data table using Power Automate prior to you then consuming it.
Excel Data table primer
What am I talking about when I’m describing a data table? Basically it’s like a named range but with a lot more capability. Here’s a nice handy summary from https://spreadsheetplanet.com/
- Cells in an Excel table need to exist as a contiguous collection of cells. Cells in a range, however, don’t necessarily need to be contiguous.
- Every column in an Excel table must have a heading (even if you choose to turn the heading row of the table off). Named ranges, on the other hand, have no such compulsion.
- Each column header (if displayed) includes filter arrows by default. These let you filter or sort the table as required. To filter or sort a range, you need to explicitly turn the filter on.
- New rows added to the table remain a part of the table. However, new rows added to a range or are not implicitly part of the original range.
- In tables, you can easily add aggregation functions (like sum, average, etc.) for each column without the need to write any formulas. With ranges, you need to explicitly add whatever formulas you need to apply.
- In order to make formulas easier to read, cells in a table can be referenced using a shorthand (also known as a structured reference). This means that instead of specifying cell references in a formula (as in ranges), you can use a shorthand as follows:
=[@Qty]*[@Sales]
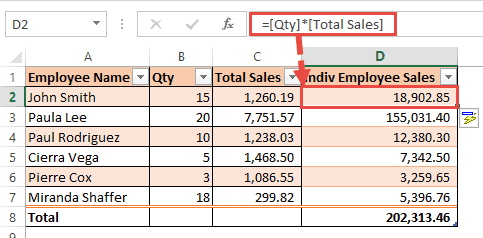
- Moreover, in a table, typing the formula for one row is enough. The formula gets automatically copied to the rest of the rows in the table. In a range or named range, however, you need to use the fill handle to copy a formula down to other rows in a column.
- Adding a new row to the bottom of a table automatically copies formulae to the new row. With ranges, however, you need to use the fill handle to copy the formula every time you insert a new row.
- Pivot tables and charts that are based on a table get automatically updated with the table. This is not the case with cell ranges.
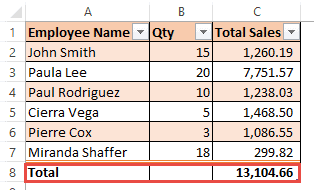
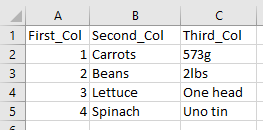
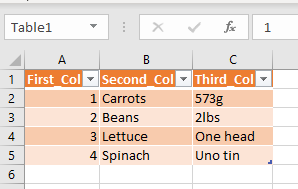
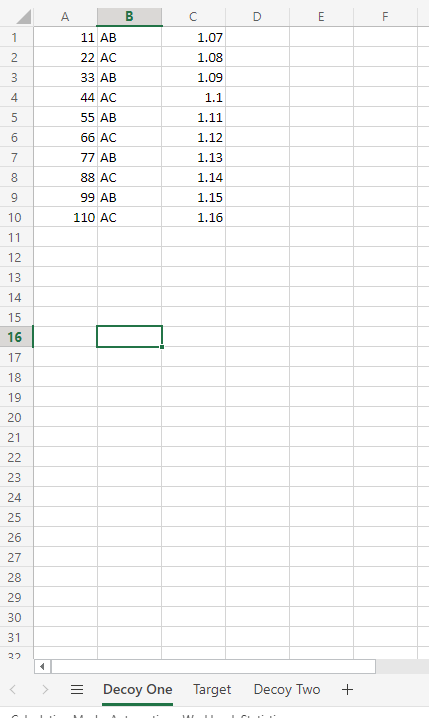
To create a data table from existing data in a worksheet is very easy. Take the following example:
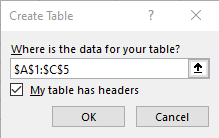
To turn this into a data table simply select the range of cells and choose the [Format as Table] drop down in the Styles section of the main tool bar.
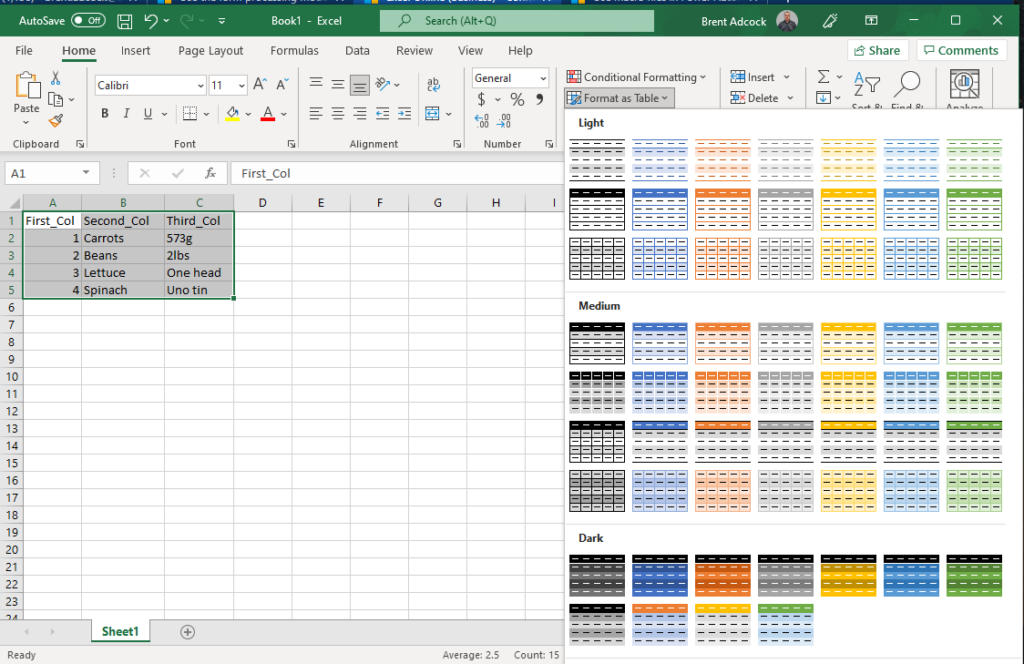
From there pick your desired colour scheme and confirm the cell range, including if there is a header row present.
Click on Ok and now you have a data table with the default name of Table1. You can modify this by selecting the name in the drop down and manually changing it.
Even though this is nice and simple to do, it would quickly get monotonous having to set up any more than about 10 by hand.
Can you feel the Power
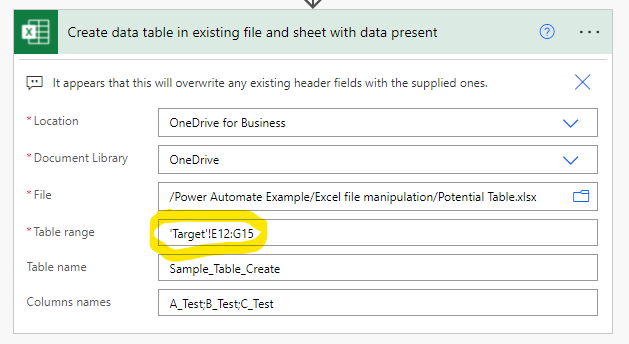
So how do we do this in Power Automate? – quite simply actually. There is an action provided in the Excel connector to explicitly do this.
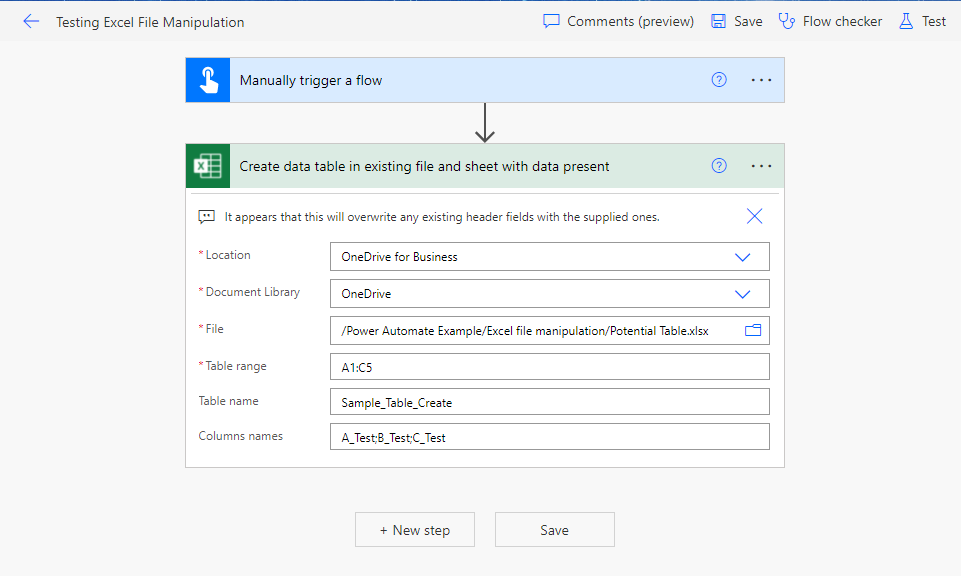
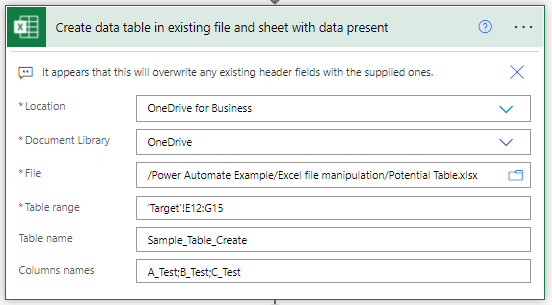
I’ve set up the above flow for a sample excel file with the same data as shown above in the manual example. The first three fields are the same as in the previous blog post, namely identifying the file and where it is. Table range uses the Excel range notation to identify the desired range in our spreadsheet. Columns names allows us to provide a new header row (or overwrite the existing one).
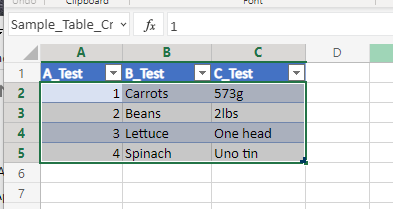
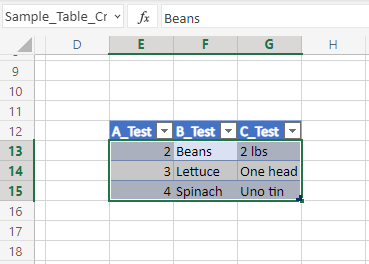
Running the above flow gives us the following result – one nicely formatted data table using our provided name.
Now the example I was using is pretty simple – data in the top left corner and a single sheet, but what if we have multiple sheets in the workbook and we want to define a table in another location on the sheet. So here’s an example of that:

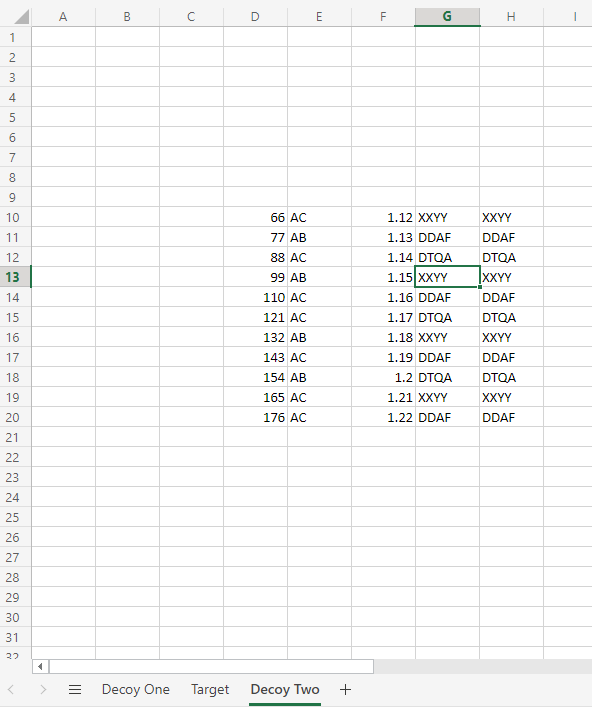
To specify the precise location of where we want to define the table we just need to enhance the Table range field in our action to explicitly name the Worksheet we’re interested in.
Once we run the flow we once again get our desired outcome.
Using the newly created data table – Static files
Here’s an example flow that runs successfully and copies data from an excel file (with no data table present) to a specific destination excel file. I’ll go into detail each of the steps configuration shortly.

This is the same Create Table action that we covered above – it takes our specified file and creates a data table where we want it.
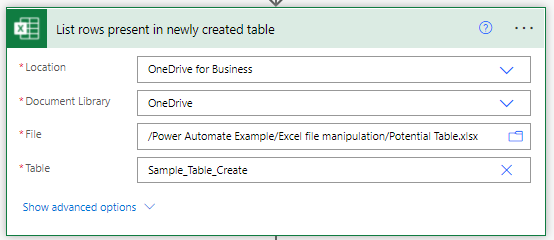
The second action appears straight forward as well, but there are some subtle differences. When the action was created and defined the source spreadsheet had the data table Sample_Table_Create present (having been done by a previous run of the Create data table action flow). Also the Table name is not chosen from the list of available data tables, but is instead supplied explicitly as a Custom Value.

The action that writes out the contents of the read data table is fairly generic as well and you can see that we have no problem identifying the input fields from the previous action either.
NOTE: This was all created with the proposed data table already existing in the source Excel workbook. After the flow was created I went back into the Potential Table.xlsx file and converted the data table definition to a named range (essentially removing it from the file). Then I ran the flow successfully.
What about dynamic files?
Well here’s an example flow that handles the following situation:
There are a collection of excel files in an input folder and the information recorded in each needs to collated into a single output file. Each run needs to write the collated information into its own unique worksheet in the collated output file.
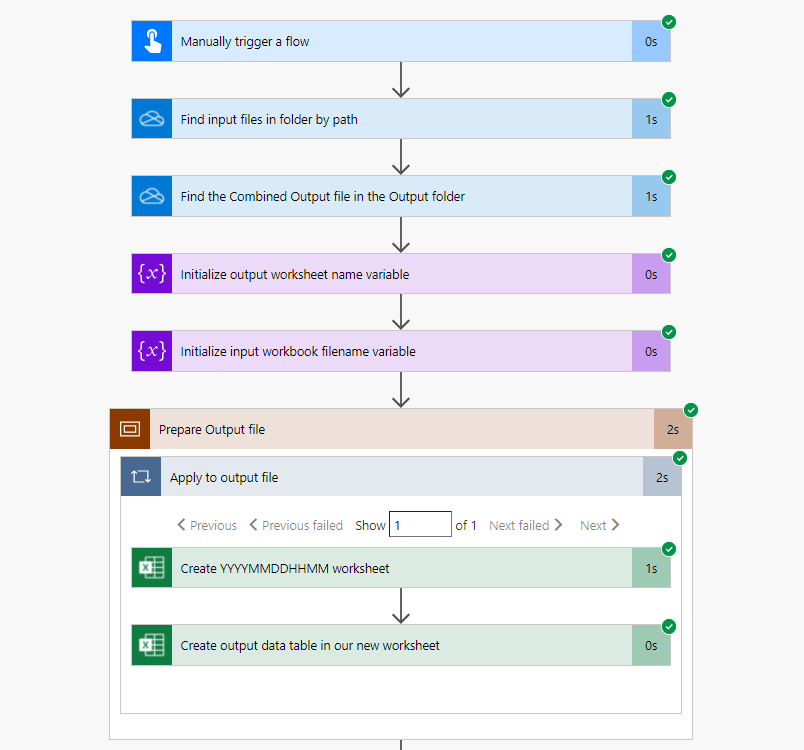
Here are screenshots of the Power Automate Flow that I created for this example:
.png)
Lets go through this in more detail and I’ll try and explain how I got this to work:
.png)
Identify your files
Making use of the One Drive action to find files in a specified path, I’m identifying the collection of files in the Input File folder, and finding the desired output file in its folder.
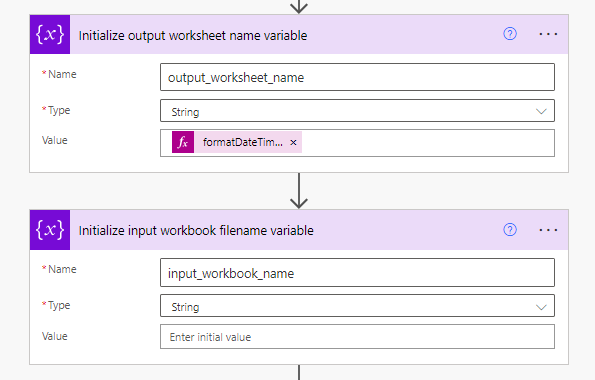
Creating helpful variables
Next I define two helpful variables that are used later on. The second one is pretty self-explanatory – it just stores the individual input file name so that we can write it out to our collated data. The first variable requires a bit more explanation. Since we’re going to need a new destination worksheet for each time we run and Sheet[1-n] is a bit boring I decided to generate a numerical representation of the date and time that the flow was run (which helps identify when the worksheet was populated). This is done in the Value field via the Power Automate Expression language, i.e. formatDateTime(utcNow(),’yyyyMMddHHmm’).
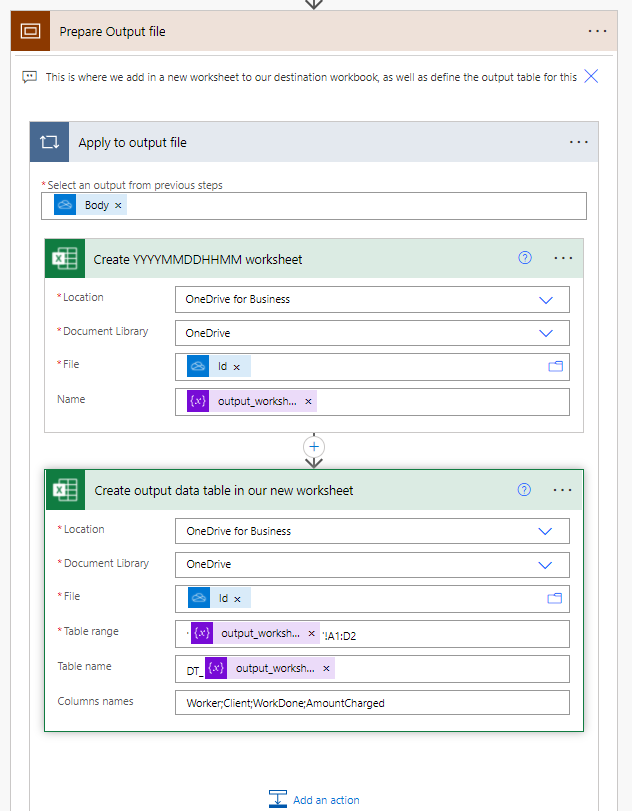
Prepping the output file
Having generated a worksheet name for our output excel workbook, we now get on with creating it. The first action identifies the File with the dynamic Id value from the previous action that found the output file, and then creates a worksheet with our generated name (from the variable). The second action once again uses the dynamic Id value to identify the working file and defines the data table that we will be populating with data later on.
Some important things to note here:
- When the actions were initially defined in the flow editor they used an existing sample File which was manually specified. After the development bugs were ironed out the value in the File field was replaced with the dynamic ID value.
- The Table range field evaluates to the form ‘SheetName’![Cell Range] and only needs to be two rows (header plus a blank) as adding rows later on will create new rows as necessary in the data table (you don’t need to preallocate space).
- Table name evaluates to ‘DT_SheetName’. I discovered that you can’t have a data table with the same name as a worksheet – Excel needs those names to be different – hence the prefix. This could be done more elegantly with variables if you want.
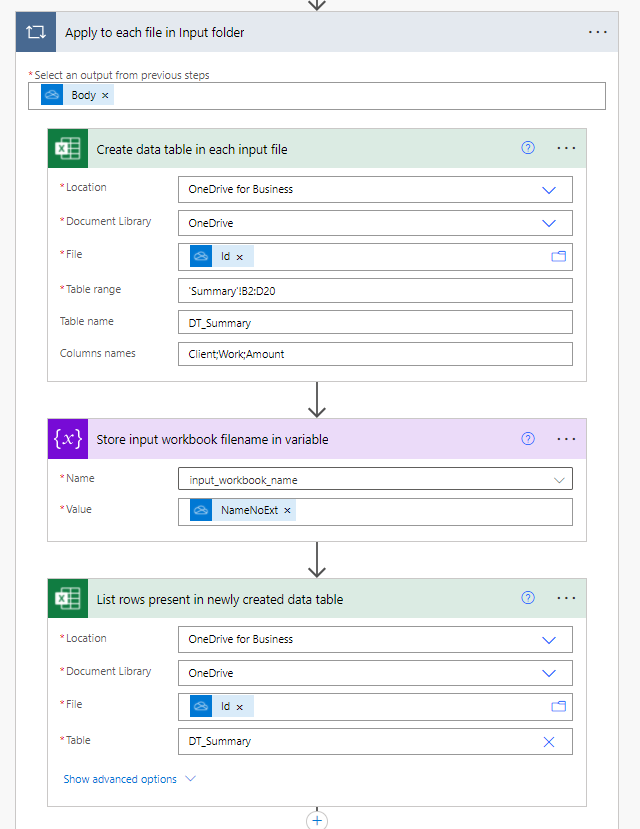
Reading the input files
Now we get onto the input files. As shown earlier in this post if we don’t have a data table present in the source file we can create one. When defining the size of the data table I’ve allocated an arbitary maximum size (3 col x 18 row) – if the data is smaller then we will have extra blank rows – if larger then we will miss rows (so size appropriately). The input_workbook_name variable stores the name of our input file (without the xlsx extension) so that it can be written out into the collated data to identify which file each row came from. Then we obtain a set of rows from our newly created data table.
As noted above the initial development work was performed with an existing sample File which was manually specified. After the development bugs were ironed out the value in the File field was replaced with the dynamic ID value.
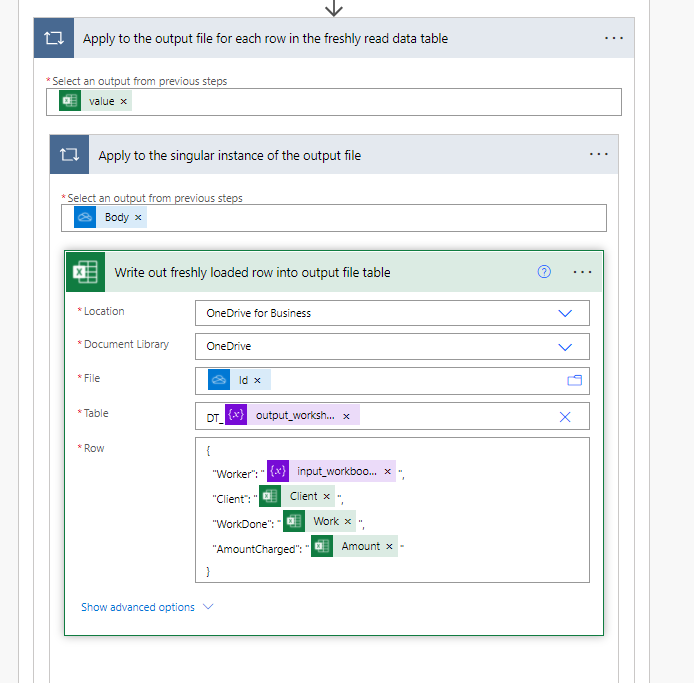
Finally writing out the data
Now we write out the rows of data that we read in from the input files. The outer loop is for each row of data from the input file data table, the inner loop is automatically placed for the output file as we’re getting it from a collection (of one). Once again all the initial development was performed with sample files and these were later replaced by the appropriate dynamic values.
Just in case you were curious here is the output that was generated from the successful flow run.
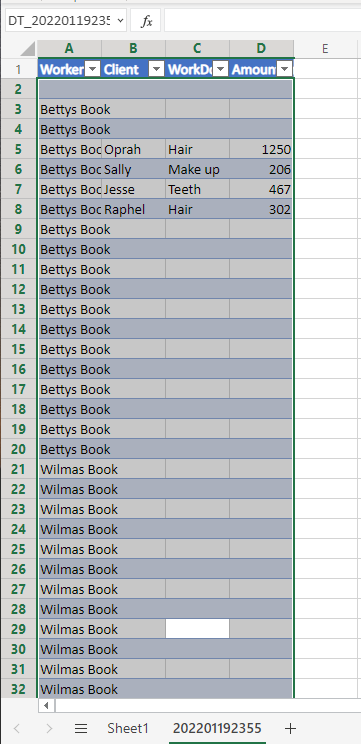
Final Output
You can see there would still be some tweaking to do around filtering out empty rows but I think it’s been a good example so far.
Tally ho.
