
After having an opportunity to use Power BI at a client site, I thought it would be interesting to have a go at trying to create a Power BI report using Jira data. To access this data dynamically I chose to use the Jira REST Application Programme Interface (API) (https://developer.atlassian.com/server/jira/platform/rest-apis/). The API allows data to be returned from Jira in response to a request detailing what information we would like in a JSON format.
For this project I had three main goals:
- Understanding what data is available from Jira REST API’s.
- How to get the data into Power BI and transform that data into a usable reporting format.
- Build a prototype report in Power BI
Getting Started
Firstly, I need some Jira data that I could use for reporting. I set up a project in Jira that would reflect a standard agile project. This included setting up an epic, three sprints and creating tasks (issues) within the sprints. I recorded time against the tasks and closed tasks as you would in an agile project. I roped a few colleagues to the same to get representative sample data for a team project.
Investigating Jira REST API data
The next task was to look a what data was available from the API’s. Jira’s Agile REST APIs provide access to resources (Jira data entries) via Universal Resource Identifier (URI) paths. The URI’s for the Jira’s Agile REST API resource have the following structure: http://host:port/context/rest/api-name/api-version/resource-name.
I found the following API strings that contained useful data for reporting purposes:
- GET /rest/agile/1.0/board/{boardId}/issue – Returns all issues from a board for a given ID.
- GET /rest/agile/1.0/board/{boardId}/sprint/{sprintId}/issue – Returns all issues you have access to that belong to the sprint from the board. Issues returned from this resource contains additional fields like sprint, closed sprints, flagged and epic.
- GET /rest/agile/1.0/epic/{epicIdOrKey}/issue – Returns all issues that belong to the epic, for the given epic ID. This only includes issues that the user has permission to view. Issues returned from this resource include Agile fields, like sprint, closedSprints, flagged, and epic
- GET /rest/api/3/search?jql=project={projectIdOrKey}&fields – search for issues using JQL via the Jira REST API, this example return all fields within the specified project.
Importing the data into Power BI
The next step was to get the Jira API data into power BI. I did this by using the Web connector in the menu Home > Get Data section of Power BI. You then input the API URI that you require:
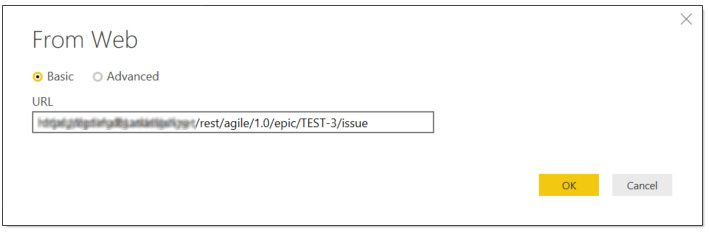
This returns a very sparse data-set in the Power Editor Query Window.
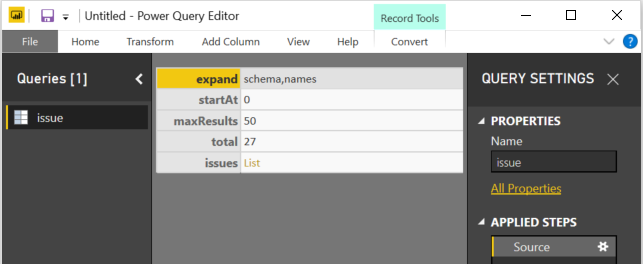
I then had to go through the following steps to obtain usable data from the JSON payload:
- Convert to table
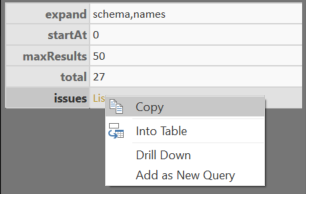
2. Drill down on the ‘List’
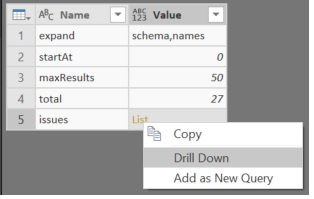
3. Convert the drill down results to a table
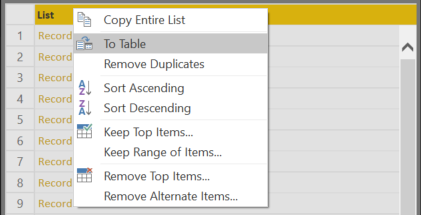
4. Expand columns
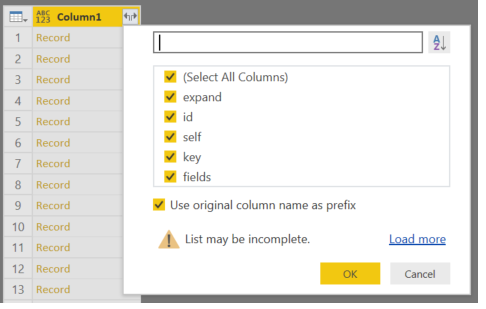
5. Expand columns again
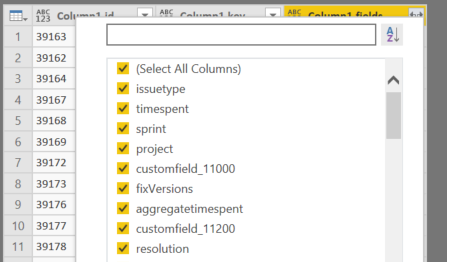
6. Rename and reformat columns as required.
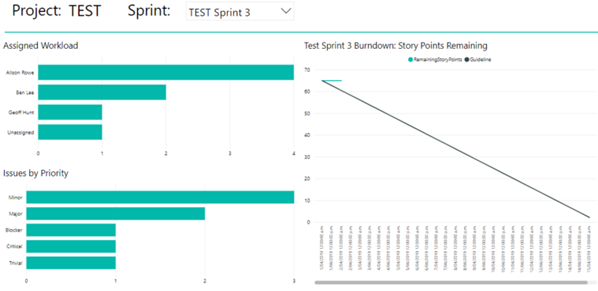
Building a prototype report
From the data imported into Power BI from the Jira REST APIs I was able to generate the following charts in Power BI:
- Assigned Workload
- Issues by Priority
- Active sprint burn-down chart
This produced the following prototype report:
Overall Impressions
I’m impressed with the quantity and variety of data that is available via the Jira REST API. You seem to be able to access all the useful information that you would want from a standard agile project. However, getting the data into usable format Power BI was fiddly and time consuming, I had to work it out by trial and error. Once the data was in Power BI, creating the charts and menu was straight forward.
I think that reporting Jira data though Power BI has potential. However, due to the variety of ways that customers use and customise Jira it would be difficult to create a one size fits all report. Currently you need to tailor reports to an individual customer’s requirements.
Thanks, Alison.
