
Never has the phrase “a picture is worth a thousand words” been truer – well, in this case, a thousand words refers to lots of bits of code but you will soon see what I mean. In a previous post (Two Cans and a piece of string (Azure Data Factory)) I showed how to create an Azure Data Factory pipeline (and the other bits) to copy the contents of a local SQL Server database to an Azure SQL Database. Apart from the initial work on the Azure portal to create the SQL Database everything else was done using Azure Powershell and JSON files. But now there is a bit of graphical goodness to help us out!
Azure Data Factory UI
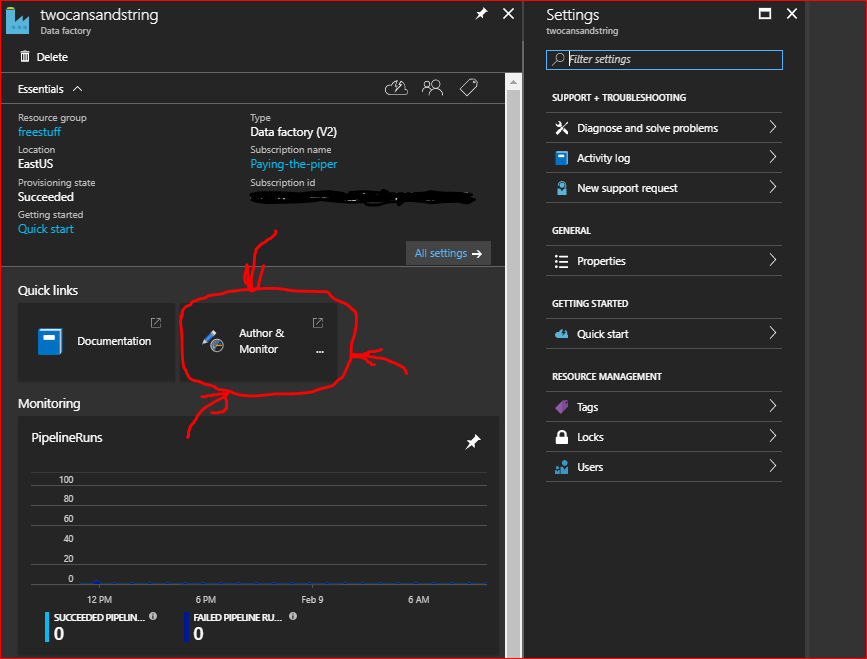
The catchy name above is now in preview on the Azure portal – let’s bring it up in all its glory. Log in to the Azure portal and bring up the Overview page for your Azure Data Factory (if you don’t have one you’ll need to create one like I did in the previous post). To open the graphical user interface click on the Author & Monitor quick link (as shown in the below screenshot with my highly artistic highlighting).
This will spawn an entirely new window which is going to be our working space.

The main navigation pane is on the left hand side, and there are some simple starting points on the overview page.
So what can we do with this? Well, why don’t we do an example of running an Azure Data Lake Analytics (ADLA) U-SQL script that curates data from one location in an Azure data lake store to another and have it scheduled to run on a regular basis?
Making sure everyone plays nicely
Before we can get started with creating our pipeline in Azure Data Factory (ADF) we need to make sure that all of our separate resources (data lake store, data lake analytics) have the necessary permissions to work with each other.
In order to do this, you first need to set up service to service authentication between the data lake store and data lake analytics. Thankfully Microsoft has a nice guide on how to do this. Note that it only details how to set up access for the data lake store, we still need to set up access for the data lake analytics which involves adding the app you will have created as a user to ADLA – click here for the details on how to do this.
As mentioned in the guides please make sure you record the Service principal ID/ApplicationID and Service Authentication Key for later use in defining the linked services.
Getting starting with linked services
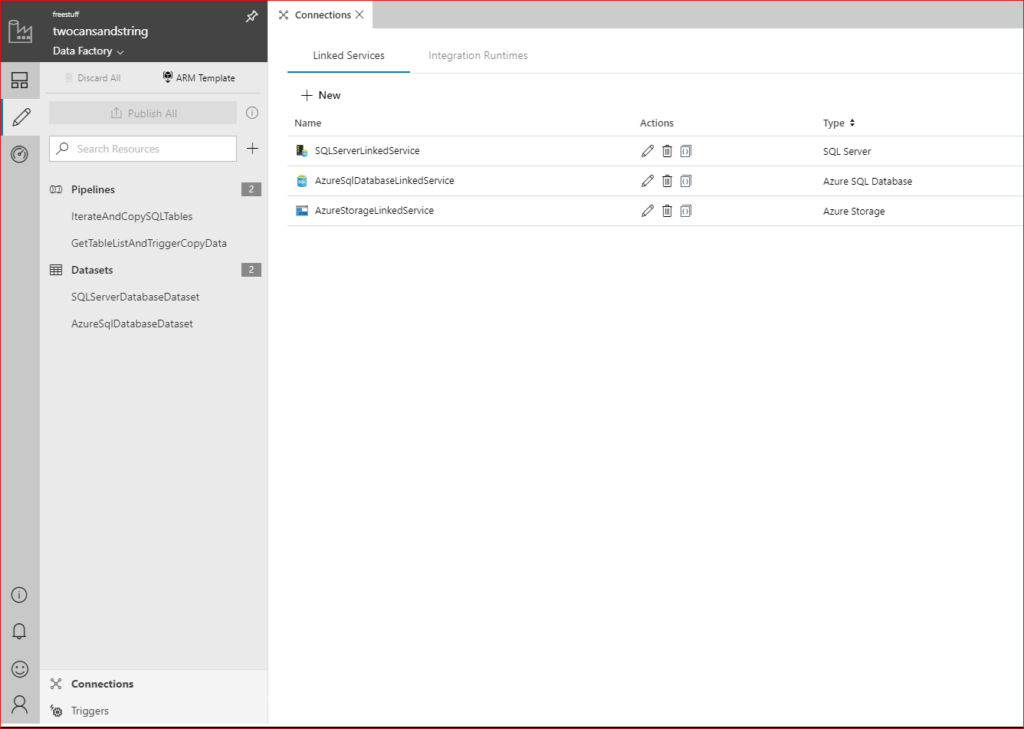
Before we can do anything with our U-SQL script we need to define our linked services that ADF will use to communicate with the data lake store and data lake analytics. Inside the ADF UI click on the Author button on the left bar (Pencil icon). This expands out a list of current resources (you may notice entities that were created as part of the past post about ADF), scroll down to the Connections group and click on it. This will bring up a list of current Linked Services and provide the option to create more (see the following screenshot).
Click on + New which gives us a nice graphical tab showing all of the available linked services we can create. Let’s start with the data lake store; to limit our choices make sure that Data Store is highlighted at the top, and that Azure is selected under the search box.
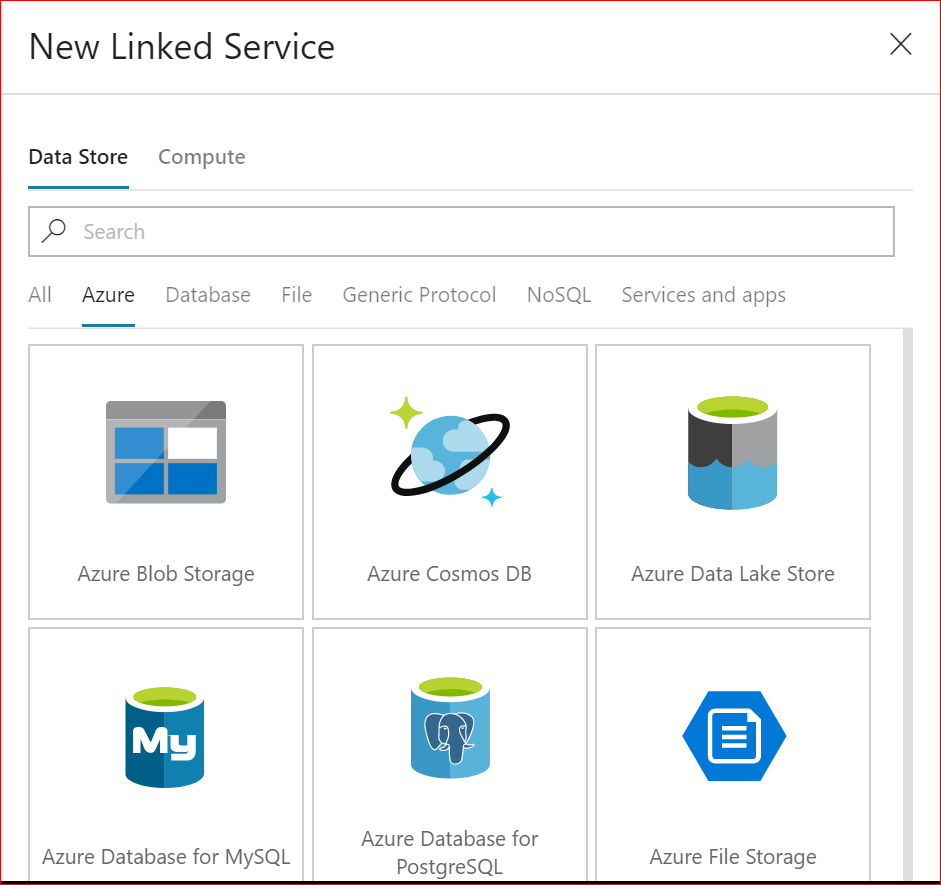
This cuts down the list of available resources nicely and we can select Azure Data Lake Store from the first row. Click on Continue and we now need to enter the configuration details:
- Name – whatever you would like – I’m going with the vanilla AzureDataLakeStore.
- Description – Up to you but make it informative.
- Connect via integration runtime – leave as Default.
- Data Lake Store selection method – I’m leaving mine as From Azure subscription since I don’t want to manually details if I don’t have to.
- Azure subscription – select it from the drop-down list if available, otherwise enter it manually.
- Data Lake Store account name – select if from the drop-down list if available, otherwise enter it manually.
- Tenant – this should auto-populate.
- Service principal ID – This is the ApplicationID from the Azure AD process we followed earlier that creates an App that has the authorization to access the data lake store and data lake analytics.
- Service principal key – This is the key value that you should have copied during the creation of the authorization app above.
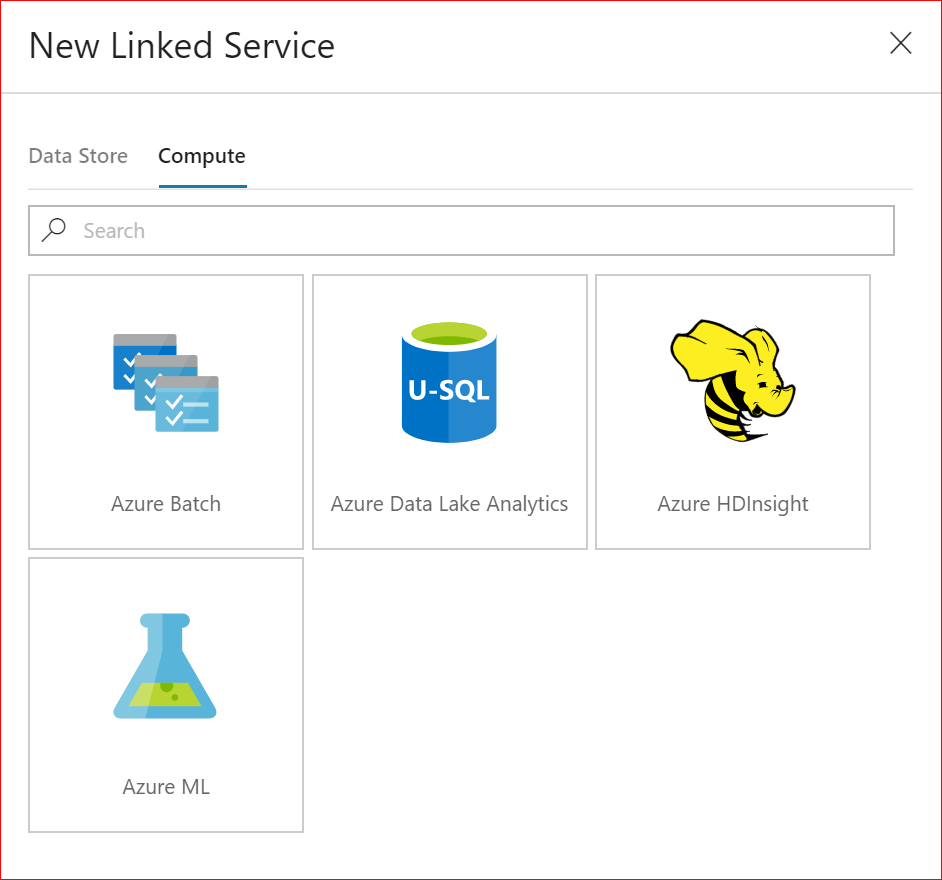
Click on Test Connection to verify we got everything right and then on Finish. That will now add the data lake store to the list of linked services. Now we do the same for the data lake store analytics. Click on + New and make sure that Compute is highlighted at the top. From the nice short list of resources click on Azure Data Lake Analytics and click on Continue.
The configuration of this linked service uses the same details as for the Data Lake Store, except that all references to selection method, subscription and account name are now to do with the data lake analytics. At the end of this, you should now have two entities in the Linked Services tab ready to go.
Laying some pipe
Because we’re getting data lake analytics to do all the work with a U-SQL script within the data lake store we don’t need to create any datasets on top of our Linked Services. Instead, we can go straight to the pipeline creation – in the left pane containing a list of resources click on the + symbol next to the search resources text box. This will spawn the pipeline editor pane with a collection of different activities that can be used.
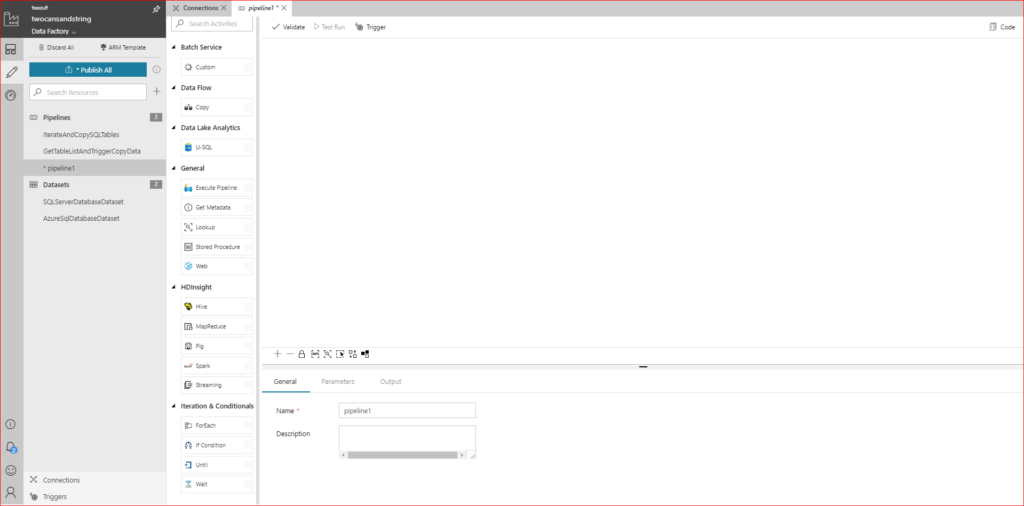
Lots of options there, but for the moment we are only interested in the U-SQL activity under Data Lake Analytics. Let’s drag it to the editor and see what needs configuring.
General Properties Tab
- Name – needs to be unique for the pipeline and can’t contain any spaces.
- Description – not necessary but helpful if you put one.
- Timeout – The default is 7 days! – since this is a simple script I’m going with 5:00 minutes (make sure you keep the original format including 0 values for the days otherwise you get validation errors).
- Retry – Leave as zero as we’re only doing a demonstration.
- Retry interval – Not relevant has the number of retries is set at 0.
ADLA Account Tab
This is where we bring in the Azure Data Lake Analytics Linked Service that we created above – you should be able to select it straight from the drop-down list. If you haven’t created one yet (or you want to create a different one) you can do this now with the +New button.
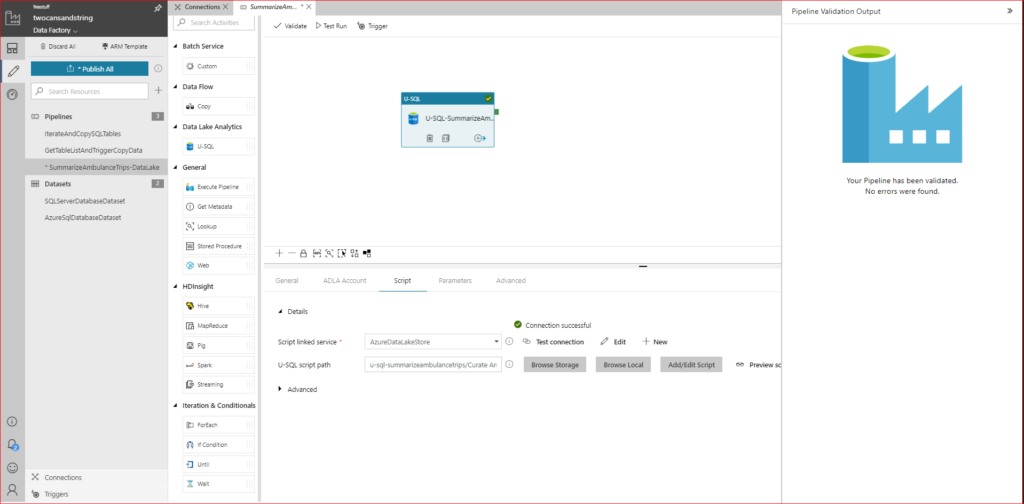
Script Tab
- Script linked service – this is where we bring in the Azure Data Lake Store Linked Service we created earlier.
- U-SQL script path – There are 3 options here for specifying where your U-SQL script is located:
- Browse Storage – This lets you browse through the data lake store structure.
- Browse Local – This lets you go looking for the script on your local development machine.
- Add/Edit Script – This lets you paste/create a script in an editor pane and it will associate it with the U-SQL Activity.
There are other tabs and options that allow you to customize the way that the U-SQL script is run, but I’m not going to get in those here since we’ve got a very simple demonstrator script. To make life simple I copied the U-SQL script up to the data lake store and used the Browse Storage option to locate it.
Validation and trial run of U-SQL Activity
Having pasted the U-SQL script in place, we now need to check if everything is good to go. Simply click on the Validate button at the top of the pipeline design pane and everything going well you should get the following results:
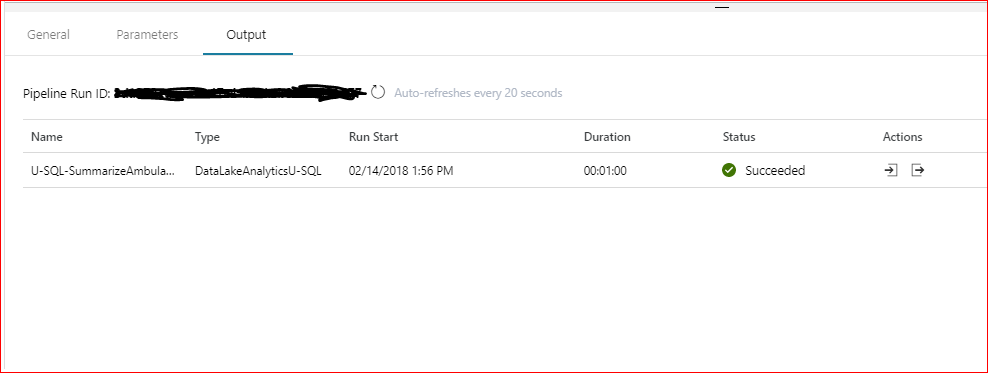
Now click on Test Run and after a period of time you should get the following output in the pane directly below the design window (all going well).
If you get an error then there are a few things to verify before trying again (if the error message doesn’t put you onto the problem straight away). Does the App that is being used have the correct permissions to the source folder and files? This should also be checked for all involved folders including the planned destination folder, and the folder containing the U-SQL script file.
Publishing and Triggering
Once you’re happy with the output for your activity you can publish it up to the Data Factory. In the left pane simply click on the blue Publish All button – this publishes entities (linked services, datasets, and pipelines). You will get a notification message indicating that publishing is underway – which should change to success!
Now let’s talk about triggering. There are two types of trigger: Manual and Scheduled and their names perfectly describe how they are run. They don’t describe how to use them though which is the goal of the following sections:
Manual Trigger
To do this for a pipeline simply open it in the Activity design window and navigate to the Trigger button in the top bar (alongside Validate and Test Run). Clicking on it will give two options – select the Trigger Now option and then click Finish in the Pipeline Run pane that spawns (this can be used to supply parameters for a run – which this sample script doesn’t have).
Go to the Monitor tab on the left (arrow gauge). You see a pipeline run that is triggered by a manual trigger. You can use the links in the Actions column to view activity details and to rerun the pipeline. Clicking on the icons in the Actions column will (depending on the pipeline) allow you to drill down into each of the involved activities.
Scheduled Trigger
To create a new scheduled trigger for our pipeline, make sure it’s selected and click on the Trigger button in the top bar (alongside Validate and Test Run). Clicking on it will give two options – select the New/Edit option and we get an Add Triggers window spawned. Under the Choose Triggers drop down, click on + New (if you had an existing scheduled trigger that you wanted to use this is where you would select it).
We now have a collection of properties to fill:
- Name – something nice and descriptive that summarizes your trigger nicely.
- Description – up to you.
- Type – let’s go with the straightforward Schedule for now (I’ll explain Tumbling Window below).
- Start Date – this should be populated for you.
- Recurrence – let’s go with Every Minute and set the interval to 10 minutes.
- End On – remember each pipeline run has a cost with it, so for a trial scheduled trigger make sure you set your end date appropriately.
- Activated – check this box for your trigger to be ready to run once it is published.
Click on Next. In the next window, we can provide parameters if the pipeline allows it. Click Finish and you be able to find your new trigger in the Triggers group (in the left pane). At this point the trigger is not “live” as it still needs to be published. Click on the blue Publish All button and the trigger will be activated. Use the Monitor tab (far left) to check on the progress of your pipeline.
Tumbling Window Scheduled Trigger
When you were creating the scheduled trigger above you would have noted the other option for a Tumbling Window scheduled trigger. This is a trigger that fires at a periodic time interval from a specified start time. Tumbling windows are a series of fixed-sized, non-overlapping, and contiguous time intervals. A tumbling window trigger has a one-to-one relationship with a pipeline and can only reference a singular pipeline. Interestingly you can schedule these to occur in the past which would allow you to sequentially load historical data.
There are a few more detailed properties that can be set for this type of trigger (compared with the standard scheduled trigger):
- Frequency – options are minute or hour. If the startTime date values are more granular than the frequency value, the startTime dates are considered when the window boundaries are computed. For example, if the frequency value is hourly and the startTime value is 2016-04-01T10:10:10Z, the first window is (2017-09-01T10:10:10Z, 2017-09-01T11:10:10Z).
- Interval – A positive integer that denotes the interval for the frequency value, which determines how often the trigger runs.
- StartTime – The first occurrence, which can be in the past. The first trigger interval is (startTime, startTime + interval).
- EndTime – The last occurrence, which can be in the past.
- Delay – The amount of time to delay the start of data processing for the window. The pipeline run is started after the expected execution time plus the amount of delay. The delay defines how long the trigger waits past the due time before triggering a new run. The delay doesn’t alter the window startTime. For example, a delay value of 00:10:00 implies a delay of 10 minutes.
- MaxConcurrency – The number of simultaneous trigger runs that are fired for windows that are ready. For example, to back fill hourly runs for yesterday results in 24 windows. If maxConcurrency = 10, trigger events are fired only for the first 10 windows (00:00-01:00 – 09:00-10:00). After the first 10 triggered pipeline runs are complete, trigger runs are fired for the next 10 windows (10:00-11:00 – 19:00-20:00). Continuing with this example of maxConcurrency = 10, if there are 10 windows ready, there are 10 total pipeline runs. If there’s only 1 window ready, there’s only 1 pipeline run.
- retryPolicy: Count – The number of retries before the pipeline run is marked as “Failed.”
- retryPolicy: intervalInSeconds – The delay between retry attempts specified in seconds.
That’s about it for a quick introduction to the Azure Data Factory UI, but in the future when we’re dealing with other Azure goodies and require ADF help I will make sure to use it in examples.
Until de next de time – bork, bork, bork.
– Brent
